Ji-Qiang Zhang,
Yan Zhang,
Xiao-Li Yin,
Ping Yang,
Hai-Feng Zhang,
Ya-Ling Guo,
Wei-Dong Chen ![]()
For correspondence:- Wei-Dong Chen Email: wdchen_hbmc@126.com
Received: 4 August 2015 Accepted: 12 December 2015 Published: 29 January 2016
Citation:
Zhang J, Zhang Y, Yin X, Yang P, Zhang H, Guo Y, et al.
Effects of triptergium glycosides on ex
© 2016 The authors.
This is an Open Access article that uses a funding model which does not charge readers or their institutions for access and distributed under the terms of the Creative Commons Attribution License (http://creativecommons.org/licenses/by/4.0) and the Budapest Open Access Initiative (http://www.budapestopenaccessinitiative.org/read), which permit unrestricted use, distribution, and reproduction in any medium, provided the original work is properly credited..
Purpose: To investigate the effects of triptergium glycosides (TG) on ex
Methods: Thirty-two rats were divided into 4 groups: normal control (NC), DN, and DN-treated with TG (5 and 10 mg/kg/d) groups. After 8 weeks, body weight, blood glucose (BG), albumin (ALB), blood urea nitrogen (BUN), creatinine (SCr) and 24 h urinary total protein (UTP) of rats were determined. Additionally, ex
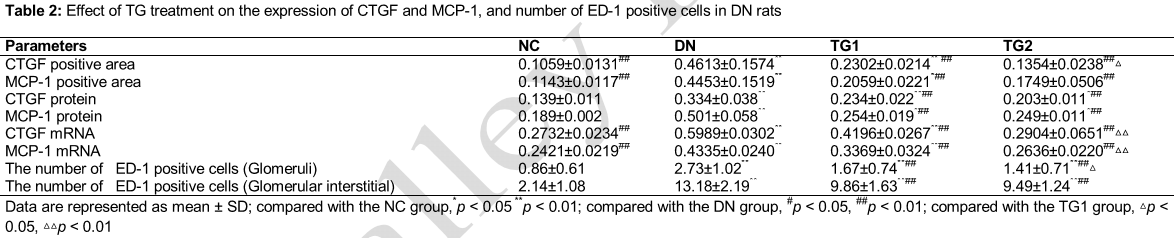
Results: BG, ALB, SCr, BUN and UTP in DN group were significantly increased (p < 0.01), compared with NC group. Compared with DN group, ALB (28.90 and 31.49 vs 23.13 g/L) and UTP (21.87 and 18.91 vs 37.19 mg/24 h) were significantly changed in TG groups (p < 0.05). ED-1 positive cells were significantly increased in DN group (p < 0.01), compared with NC group, whereas treatment with TG significantly reversed the increase (1.67 and 1.41 vs 2.73 in glomeruli, 9.86 and 9.49 VS 13.18 in glomerular interstitial, p < 0.01). Proteins and mRNA ex
Conclusion: TG ameliorates renal injury in diabetic rats via decreasing MCP-1 and CTGF ex
Introduction
Increasing clinical and animal studies have indicated that activation of the immune response and inflammatory mechanisms are important in the pathogenesis of diabetic nephropathy (DN), which is one of the chronic complications of diabetes [1]. It’s reported that chemokines, such as monocyte chemoattractant protein-1 (MCP-1) and connective tissue growth factor (CTGF), play important roles in the recruitment and activation of these immunocytes. Specifically, MCP-1 can cause extensive migration and infiltration of monocytes/macrophages in kidney actively involved in DN [2]. CTGF, a downstream effector of transforming growth factor-β1 (TGF-β1), stimulates mesangial cell proliferation and extracellular matrix (ECM) production and also promotes the development of renal fibrosis, leading to renal pathological changes associated with DN [3].
Triptergium glycoside (TG) is commonly used to treat DN based on its anti-inflammatory and immunosuppressive effects. However, the specific mechanism of TG’s renal protection is still not entirely clear. Therefore, the present study was designed to investigate the effect of TG on expressions of MCP-1 and CTGF in early DN rats and to explore its mechanism of renal protection.
Methods
Materials and chemicals
TG was purchased from Fudan Forward Co. (Shanghai, China). Streptozotocin (STZ) was purchased from Sigma Co. (USA). The following reagents were purchased from Aobosen Co. (Beijing, China): rabbit anti-rat CTGF and MCP-1 primary antibodies, mouse anti-rat ED-1 monoclonal antibody, goat anti-rabbit IgG antibody, goat anti-mouse IgG antibody and DAB horseradish peroxidase color development kit. Trizol reagent was purchased from Invitrogen Co. (USA), and RT-PCR kit was purchased from Fermentas Co. (USA). CTGF, MCP-1 and β-actin primers were synthesized by Sangon Biotech. Co., Shanghai, China. All other reagents used were of analytic grade.
Animals
Male Sprague Dawley (SD) rats (8-weeks old, weighing 180 - 200 g) were purchased from Experimental Animal Center of Bengbu Medical College (Anhui, China). All the animal protocols were established according to the generally accepted international rules strictly, and approved by the Animal Care and Use Committee of our College.
Experiment design
Thirty-two male SD rats were used in the present study. Diabetic rats were constructed by feeding a high-fat and high-sugar diet with 10 % lard, 20 % sucrose and 3 % cholesterol for 4 weeks, and given a single intraperitoneal injection (ip) of 55 mg/kg STZ in sodium citrate. Meanwhile, the rats in negative control group (NC group, n=8) were fed a normal diet, and injected an equal volume of citrate-citrate sodium buffer alone (ip). Diabetes was confirmed if the blood glucose (BG) value on the third day exceeded 16.7 mmol/L after STZ injection. Moreover, DN was confirmed if the 24 h urinary total protein (UTP) values exceeded 30 mg, and the amount of 24 h urine was increased by 50 %, compared with before induction.
After the DN rats were rendered diabetic, they were randomly divided into 3 groups, including DN group, and TG treatment groups [5 mg/kg/d (TG1) and 10 mg/kg/d (TG2)] (n = 8). TG (5 and 10 mg/kg/d) was administered orally (ig) once a day for 8 weeks. Rats in the NC and DN groups received an equivalent volume of physiological saline per day (ig). During the experimental period, antidiabetic drugs were not applied. Body weight was measured weekly, and 24 h urine was collected after induction and analyzed at the end of the study. All the animals were sacrificed after hemospasia from the heart, and then blood samples were centrifuged to obtain serum. Serum samples were stored at -20 °C until analysis. The kidneys (right and left) were dissected out and fixed in 10 % formalin for histopathological analysis or fixed in 3.75 % pentanediol for transmission electron microscopy (TEM) assay. The rest of the kidney tissues were rapidly frozen with liquid nitrogen and stored at -80 °C.
Blood sampling and biochemical analysis
By using the automatic biochemistry analyzer, blood and urine samples of rats were collected to determine the albumin (ALB), blood urea nitrogen (BUN), creatinine (SCr), UTP and other indicators. BG was measured using blood glucose monitor (Roche, Switzerland).
Electron microscopy (EM)
Tissue fragments (1 mm3) were randomly taken from the kidney tissue and fixed in 3.75 % pentanediol at 4 °C for more than 4 h, washed five or six times with 0.1 M PBS, dehydrated in ethanol, and embedded in paraffin. For electron microscopy, blocks were trimmed and sections were cut at 80 - 90 nm, mounted on copper grids, aluminum citrate stained, and viewed under the electron microscope (JEOL).
Histopathological examination
The tissue sections were stained by hematoxylin and eosin (H&E) using standard histology procedures. Immunohistochemical staining was performed using SABC kit according to the manufacturer’s instructions of commercial kits. The HPIAS-1000 high-resolution color graphic report of the pathology analysis system was used to analyze the average of the integral optical density (IDP). In each section, the number of ED-1positive cells of 10 randomly selected glomerular fields and 10 non-overlapping renal tubule-interstitial fields under high power magnification (400×) were counted.
Western blot assay
Western blot assay was performed to determine the expressions of MCP-1 and CTGF in kidney tissues. Kidney tissues were homogenized in RIPA lysis buffer supplemented with protease inhibitors and phosphatase inhibitors, using a 10 % w/v ratio. Homogenates were then centrifuged for 15 min at 11,000 g and the supernatants were stored at −80 °C. Total proteins were extracted, and the concentration was determined using a BCA reagent kits. Thereafter, the proteins were separated by electrophoresis on sodium dodecyl sulfate/polyacrylamide gel (SDS-PAGE). Following transfer onto polyvinylidene fluoride (PVDF) membranes and blocking, the membranes were incubated overnight at 4 °C with the primary antibodies of MCP-1, CTGF and β-actin (1: 100). Following several washes in TBST, the PVDF membranes were subsequently incubated with horseradish peroxidase-conjugated secondary antibody (1:1000) at 37 °C for 1 h. Thereafter, PVDF membrane was washed three times with TBST. The protein bands were detected by DAB staining, and the band densities quantified using Image J software (National Institutes of Health). For normalization of the loading, β-actin was used in the western blot assay.
Reverse transcriptase polymerase chain reaction (RT-PCR) assay
The mRNA expressions of MCP-1 and CTGF were analyzed by using RT-PCR determination. Total RNA was extracted from the renal cortical tissue by using TRIzol reagent. First strand cDNA were synthesized from 3 μg of total RNA. Sequences of the primers used in our investigation were as follows: for CTGF (160bp) 5’-AGCTGCCTACCGACTGGAAGA-3’ (forward), 5’-CTTCTCCAGCCTGCAGAAGGT-3 (reverse); for MCP-1(191bp) 5’-CCTGCTGCTACTCATT CAC-3’(forward), 5’-TCTCACTTGGTTCTGGTC-3’ (reverse); for β-actin(650bp) 5’-CTCTGGTCGTACCACTGGCATTG-3’ (forward), 5’-CCTGCTTGCTGATCCACATCTGC-3’ (reverse).
PCR experiment was performed under the following selected conditions: first pre-denaturation at 94 °C for 3 min followed by 30 cycles of reactions of denaturation at 95 °C for 50 s, annealing at 61.6 °C (CTGF), 56.2 °C (MCP-1), 63.6 °C (β-actin) for 50 s, extension at 72 °C for 1 min and last extension for 10 min at 72 °C. After amplification, the PCR products were evaluated by 1.5 % agarose gel electrophoresis. Bands were visualized and photographed on a UV trans-illuminator, and β-actin was used as internal control.
Statistical analysis
Data were statistically analyzed by using SPSS 16.0. Differences among the groups were analyzed by one-way analysis of variance (ANOVA). The t-test was used between each two groups. Data are presented as mean ± standard deviation (SD), and p < 0.05 was regarded as statistically significant.
Results
Effect of TG on fasting BG and urine biochemical parameters
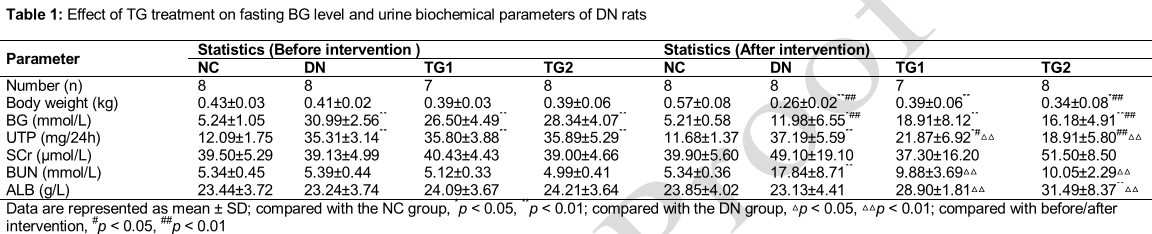
After the establishment of DN rat model, the DN rats appeared polydipsia, polyuria and emaciation. In the study, one rat in the TG1 group (5 mg/kg) died. The body weights were significantly decreased in DN group, compared with the NC group. Before treatment with TG, the BG levels of the DN rats were increased by approximately 6-fold, compared with NC rats. After 8 weeks’ treatment, the BG levels of diabetic rats were decreased but still higher than the rats in NC group. However, treating these diabetic rats with TG at doses of 5 and 10 mg/kg/d decreased the BG levels, compared with the DN group. The UTP levels of the rats were increased significantly after induction of DN, and treating these DN rats with TG decreased the UTP levels to some extent, compared with the DN group (p < 0.01). There was no statistically significant difference between each group with respect to SCr levels (). The BUN levels of the DN group was higher than the NC group (p < 0.01), and decreased significantly after treatment with TG (p < 0.01). The ALB level of TG2 group was higher than the NC group (p < 0.01).
Effect of TG on kidney pathology
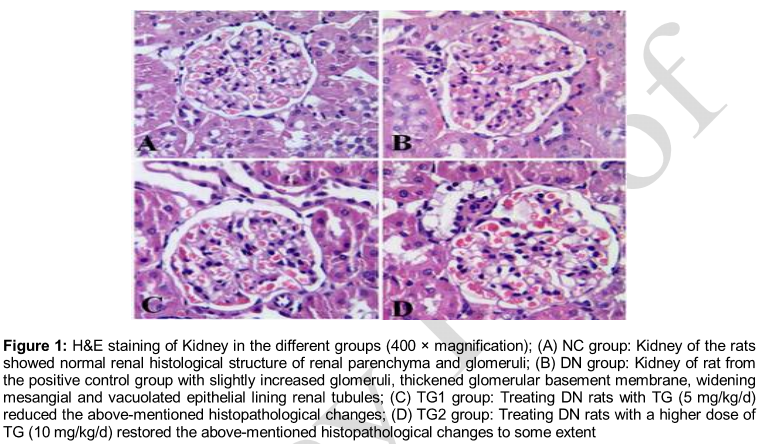
The effect of TG on the pathology of kidney was evaluated by H&E staining and EM analysis. Kidney of the rats in negative control group (NC group) stained with H&E showed normal renal histological structure of renal parenchyma and glomeruli (A). B showed kidney of rat from the positive control group (DN group) with slightly increased glomeruli, thickened glomerular basement membrane, widening mesangial, and vacuolated epithelial lining renal tubules. To some extent, treating DN rats with 5 mg/kg/d of TG in TG1 group (C) and a higher dose of TG (10 mg/kg/d) in TG2 group (D) restored the above-mentioned histopathological changes.
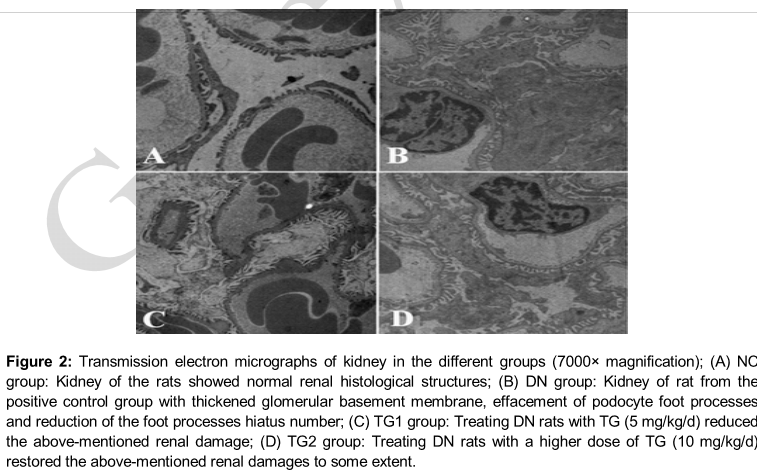
Kidney of the rats in NC group observed under TEM showed normal renal histological structures (A). B showed kidney of rat from the DN group with thickened glomerular basement membrane, effacement of podocyte foot processes and reduction of the foot processes hiatus number. In C and 2D, kidney tissue of DN rats in TG1 and TG2 treated with different doses of TG (5 and 10 mg/kg/d) reduced these renal damages.
Effect of TG on expressions of MCP-1 and CTGF in kidney tissues
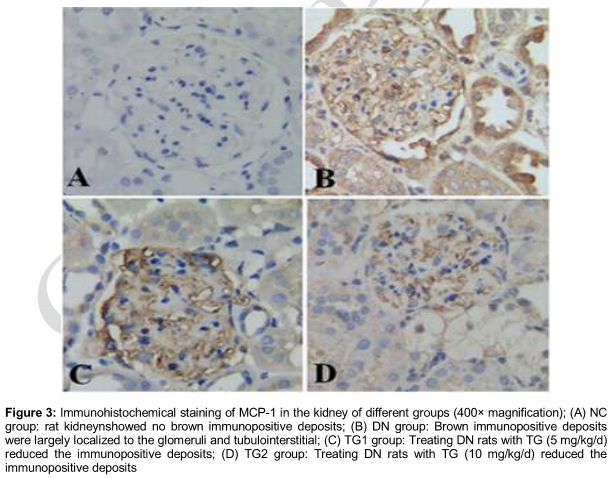
To investigate the effect of TG on expression of MCP-1 and CTGF in DN rats, immunohistochemistry, western blot and PCR analysis were performed. Immunohistochemical staining of MCP-1 and CTGF in kidney tissues were mainly localized to the glomeruli and tubulointerstitial revealing a significant increase in the DN rats, compared with the NC rats. The increase of MCP-1 and CTGF expression in the kidney of the DN rats was attenuated after treatment with TG ( and 4).
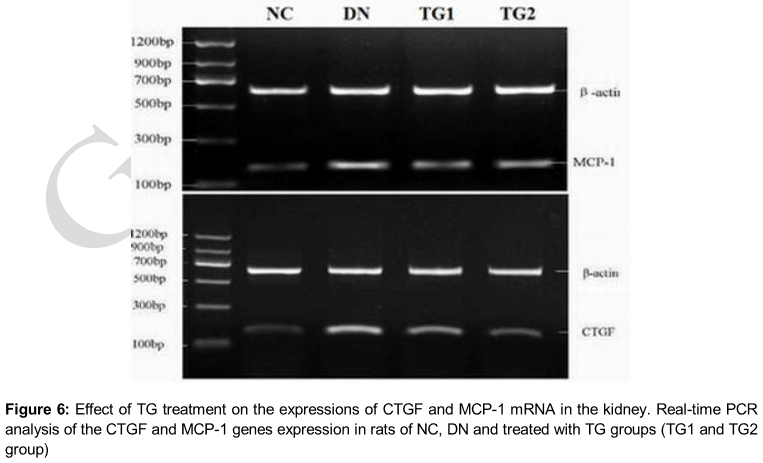
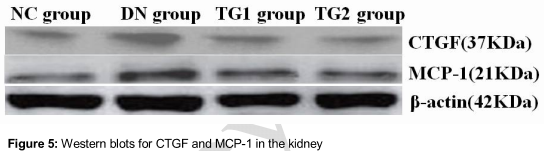
Quantitative analysis of these images showed that the expressions of MCP-1 and CTGF in the rats of DN group were significantly increased (p < 0.01), compared with the NC group, and the expressions of MCP-1 and CTGF in the rats of TG1 and TG2 group were significantly decreased (p < 0.01), compared with the DN group (). The result of western blot analysis was similar with the immunohistochemistry result. We also quantified MCP-1 and CTGF mRNA expression in kidney tissues of all the groups (). RT-PCR analysis showed that the expressions of MCP-1 and CTGF mRNA in the kidney of rats of the DN group were also significantly increased (p < 0.01), compared with the normal control rats. TG significantly reduced these DN-induced increases in the expressions of MCP-1 and CTGF (p < 0.01) (). This result demonstrated that TG prevents the expressions of MCP-1 and CTGF in rats with diabetic nephropathy.
Effect of TG on infiltration of macrophages
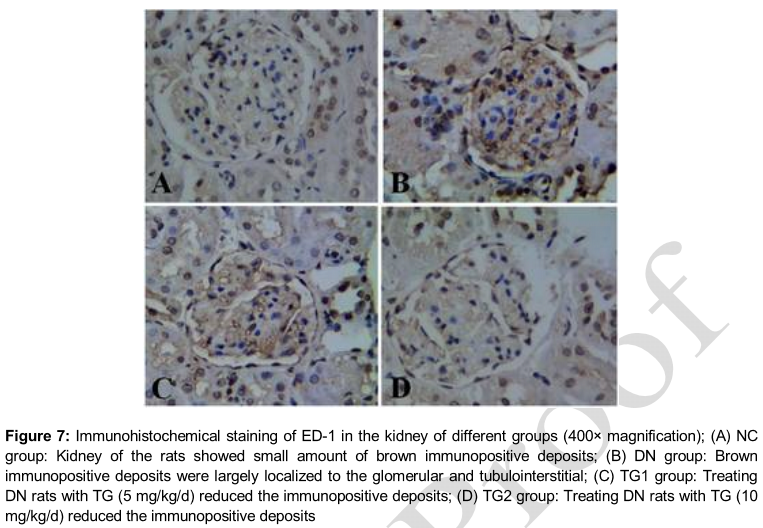
To evaluate the infiltration of macrophages in the different groups, immunohistochemical staining for the macrophage marker ED-1 was performed. As shown in and , the number of ED-1 positive cells increased significantly in the kidney of DN group (p < 0.01), compared with the NC group. After treatment with TG, the number of ED-1 positive cells in TG1 and TG2 group were decreased significantly (p < 0.01), particularly in the TG2 group, compared with the DN group.
Discussion
In the last decade, researchers have demonstrated that inflammation and alterations in the immune system play important roles in the occurrence and development of DN [1]. MCP-1 is one of the important inflammatory chemokines for promoting interstitial inflammation, and is found to correlate with severity of the disease in a variety of renal diseases [4].
Infiltration of mononuclear macrophages can stimulate innate renal cell activation and proliferation, which can promote the progression of kidney damage, increase the synthesis and aggregation of type I, III and IV collagen, induce the expression of adhesion molecules, increase the release of lysosomal enzymes and TGF, increase the expression of ECM protein and promote the development of glomerular sclerosis and interstitial fibrosis.
CTGF is an immediate early gene belonging to the CCN protein family, and is highly expressed in the kidney. It’s demonstrated that CTGF play a key role in DN caused by renal interstitial fibrosis and glomerulosclerosis, and could be a major cause of kidney damage in diabetes [5]. Urinary level of MCP-1 was observed to be significantly increased and was found to correlate with the degree of renal interstitial fibrosis and tubular atrophy [6]. Additionally, it was confirmed that urinary CTGF level could act as a sensitive early indicator of renal injury. The fact that the concentration of urinary CTGF was positively correlated with the severity of disease makes it helpful to detect, diagnose, and monitor the progression of DN [7,8].
Many previous studies have shown that glomerulosclerosis is associated with macrophage infiltration in DN, and the expressions of MCP-1 and CTGF in mesangial cell were involved in the development of DN [7,9], suggesting that MCP-1 and CTGF play important roles in the pathogenesis of this disease. Thus, MCP-1 and CTGF are potential targets for treating DN, and inhibiting the expressions of MCP-1 and CTGF might be beneficial for treating DN. Our results also demonstrated that expressions of MCP-1 and CTGF were related to the early renal damages of DN rats, and macrophages secreted many pro-fibrotic molecules after entering into the glomeruli and tubulointerstitial area under the chemotactic effect of MCP-1, which in turn promote renal interstitial fibrosis.
These results are consistent with the previous results of Wada [10]. In this study, we found that TG treatment could down-regulate the expressions of MCP-1 and CTGF in kidney and inhibit the macrophage infiltration. In addition, TG can suppress immune response, inhibit the proliferation of mesangial cells and matrix, and delay the progression of glomerulosclerosis in DN. Furthermore, TG can alleviate the renal tubular damage via inhibiting the releases of inflammatory mediators and cytokines in renal tubular epithelial cells (TECs). Thus, TG possesses promising protective effect on glomerular podocytes and tubular epithelial cells. Previous investigations reported that extracts of Tripterygium wilfordii Hook f (i.e. triptolide) could suppress the increase of MCP-1 in renal tubular epithelial cells caused by multiple stimuli [11]. The protective effect of TG on the kidneys of diabetic rats may be related to the reduction of CTGF in kidney [12]. Clinical studies also found that TG could significantly reduce proteinuria in DN, delay the onset of disease, and TG was reported to be more effective than the angiotensin receptor blocker (ARBs) drugs [13]. However, the specific mechanisms of TG still need further study.
It has been reported that infiltration of macrophage and abnormal expressions of inflammatory factors are important features of early inflammatory response in DN, and the macrophage is the main target of TG for treating DN [14]. In the present study, we found that expressions of CTGF and MCP-1 in DN rats were increased significantly, compared with that of normal rats. After treatment with TG, the infiltration of macrophage and expressions of CTGF and MCP-1 in kidney were decreased significantly. All these results suggested that TG could reduce kidney damage through down-regulating the expressions of CTGF and MCP-1, and decreasing the infiltration of macrophage.
We have further revealed that TG could inhibit the abnormal expressions of CTGF and MCP-1 in the early stages of DN rats, suggesting that TG might reduce glomerular injury through inhibiting aggregation and activated anti-inflammatory effects of macrophage. High-dose (10 mg/kg/d) TG was observed to be more effective than the low-dose TG (5 mg/kg/d) in down-regulating the expressions of CTGF and MCP-1, especially the CTGF. Furthermore, expressions of Scr and BUN decreased after TG treatment, suggesting that TG may improve the nutritional status of DN rats. The BG of rats increased after induction of DN, by the increase was reversed by treatment with TG. Moreover, high dose of TG (10 mg/kg) affected the lipid level of the rats by increasing total cholesterol and triglycerides. However, this result is not quite in line with a previous study [15]. Thus further experimental and clinical studies were needed, and it is worth mentioning that dyslipidemia, in addition to the traditional TG adverse effects, should be controlled in the clinical use of TG.
Conclusion
MCP-1 and CTGF play key roles in the occurrence and development of DN. TG exhibits notable protective effect against renal damage via inhibition of the expressions of MCP-1 and CTGF and reduction of macrophage activation. It, therefore, requires further development for treatment of early DN.
References
Archives


News Updates